Performance Statistics
In the Performance Statistics screen of our app, you can track and analyze various aspects of your progress. The features include:
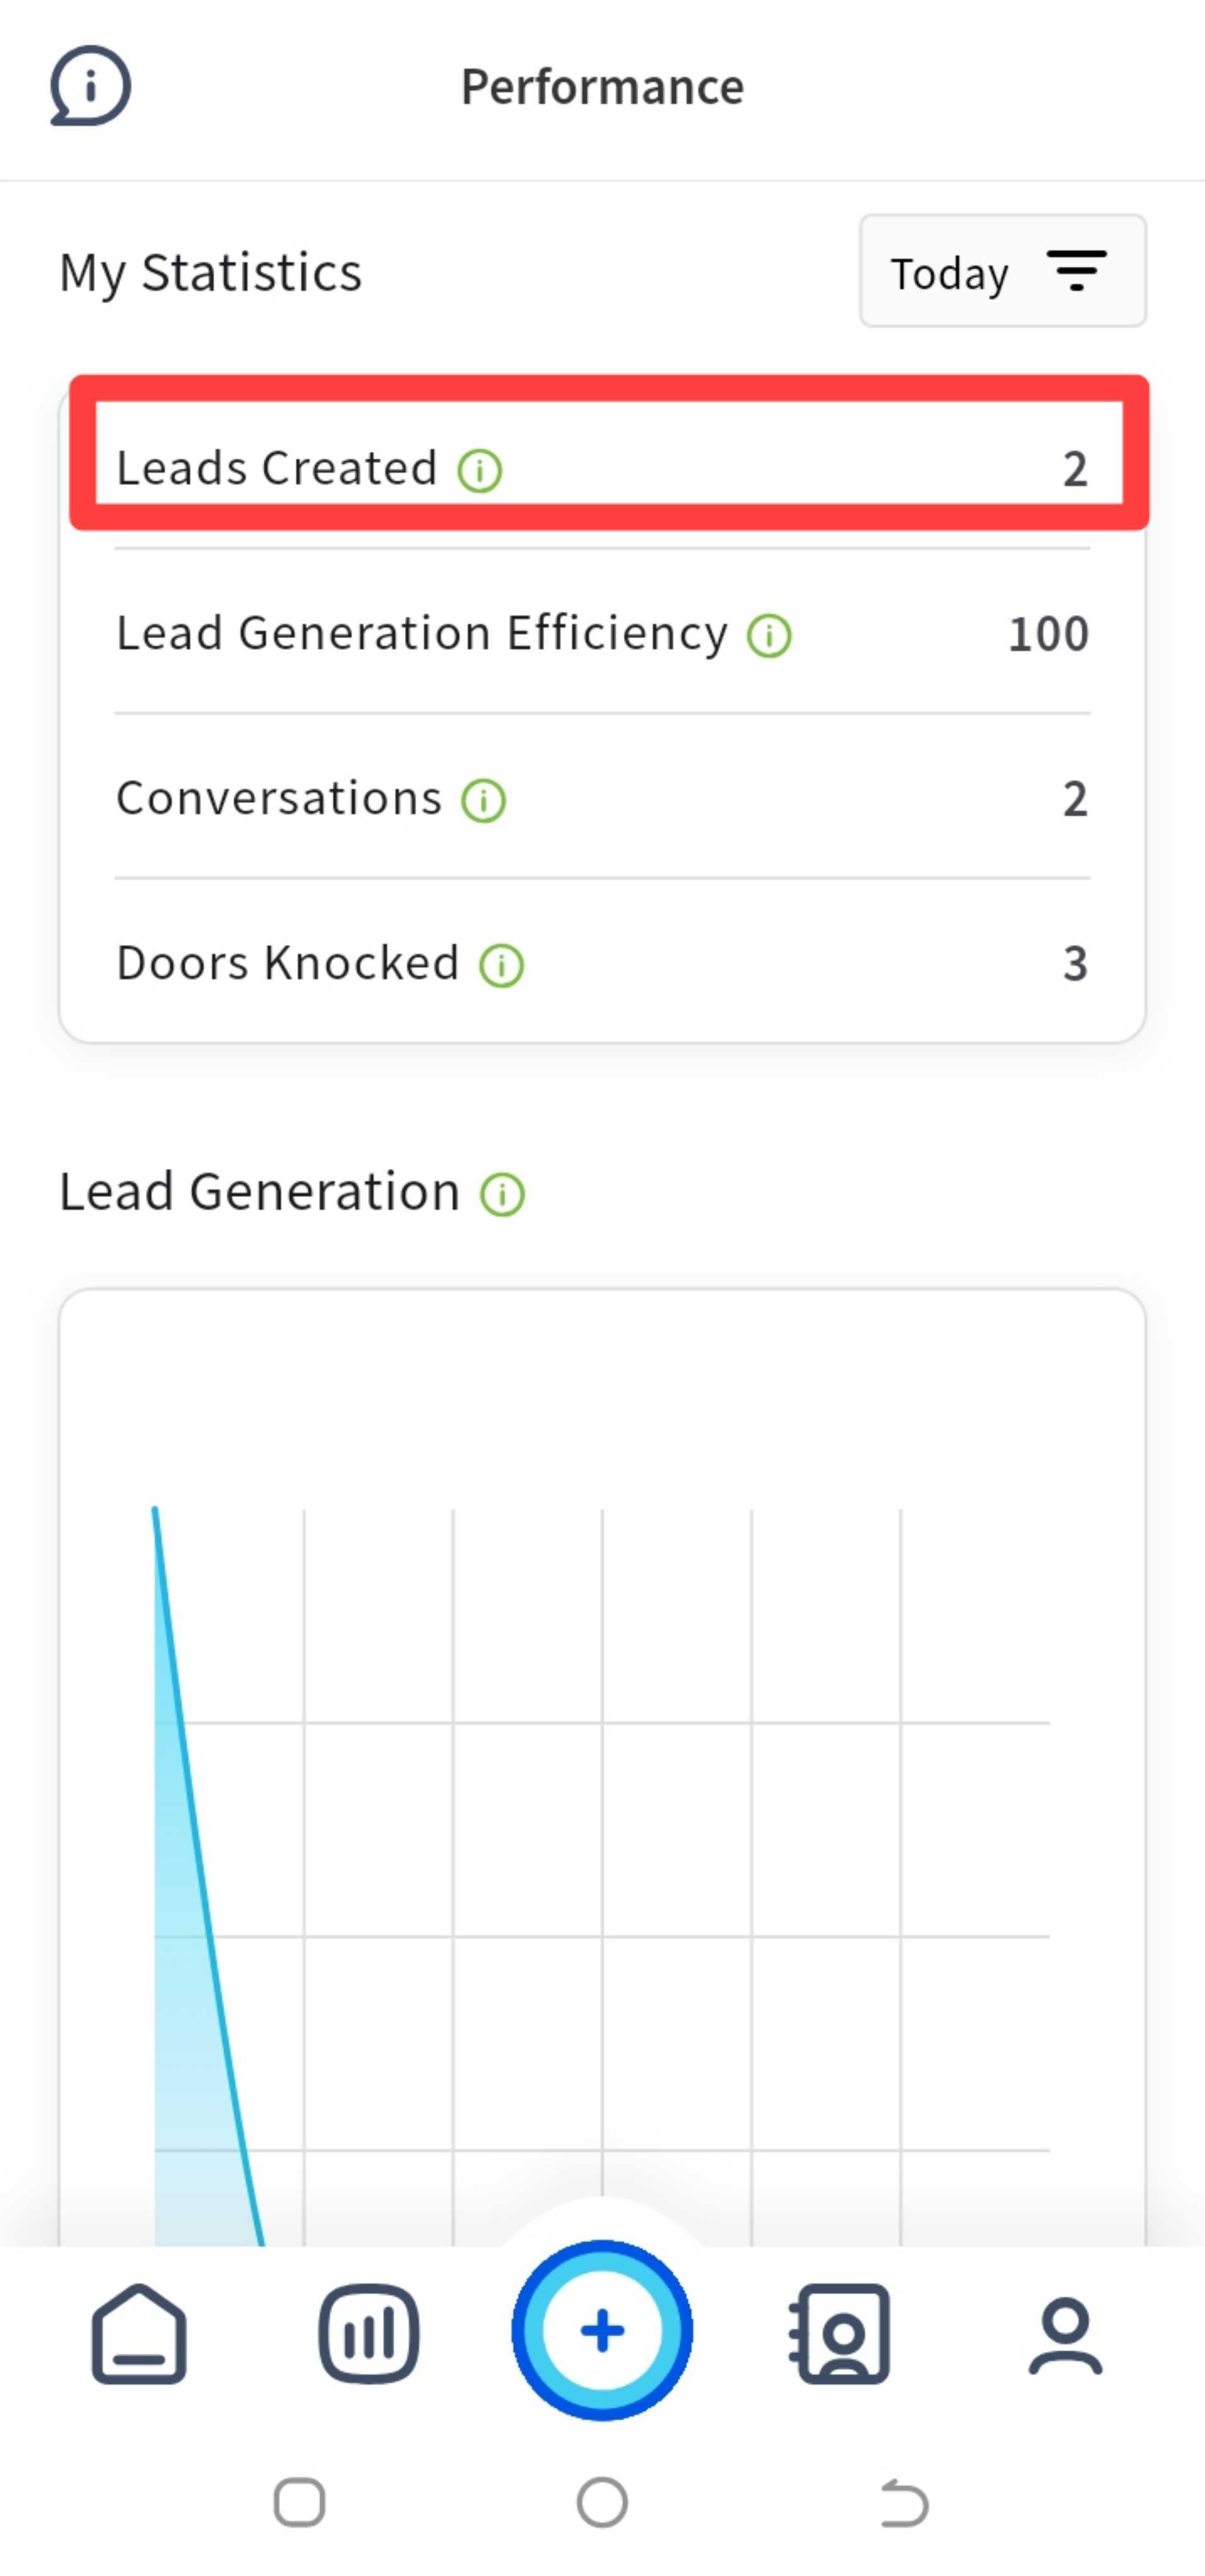
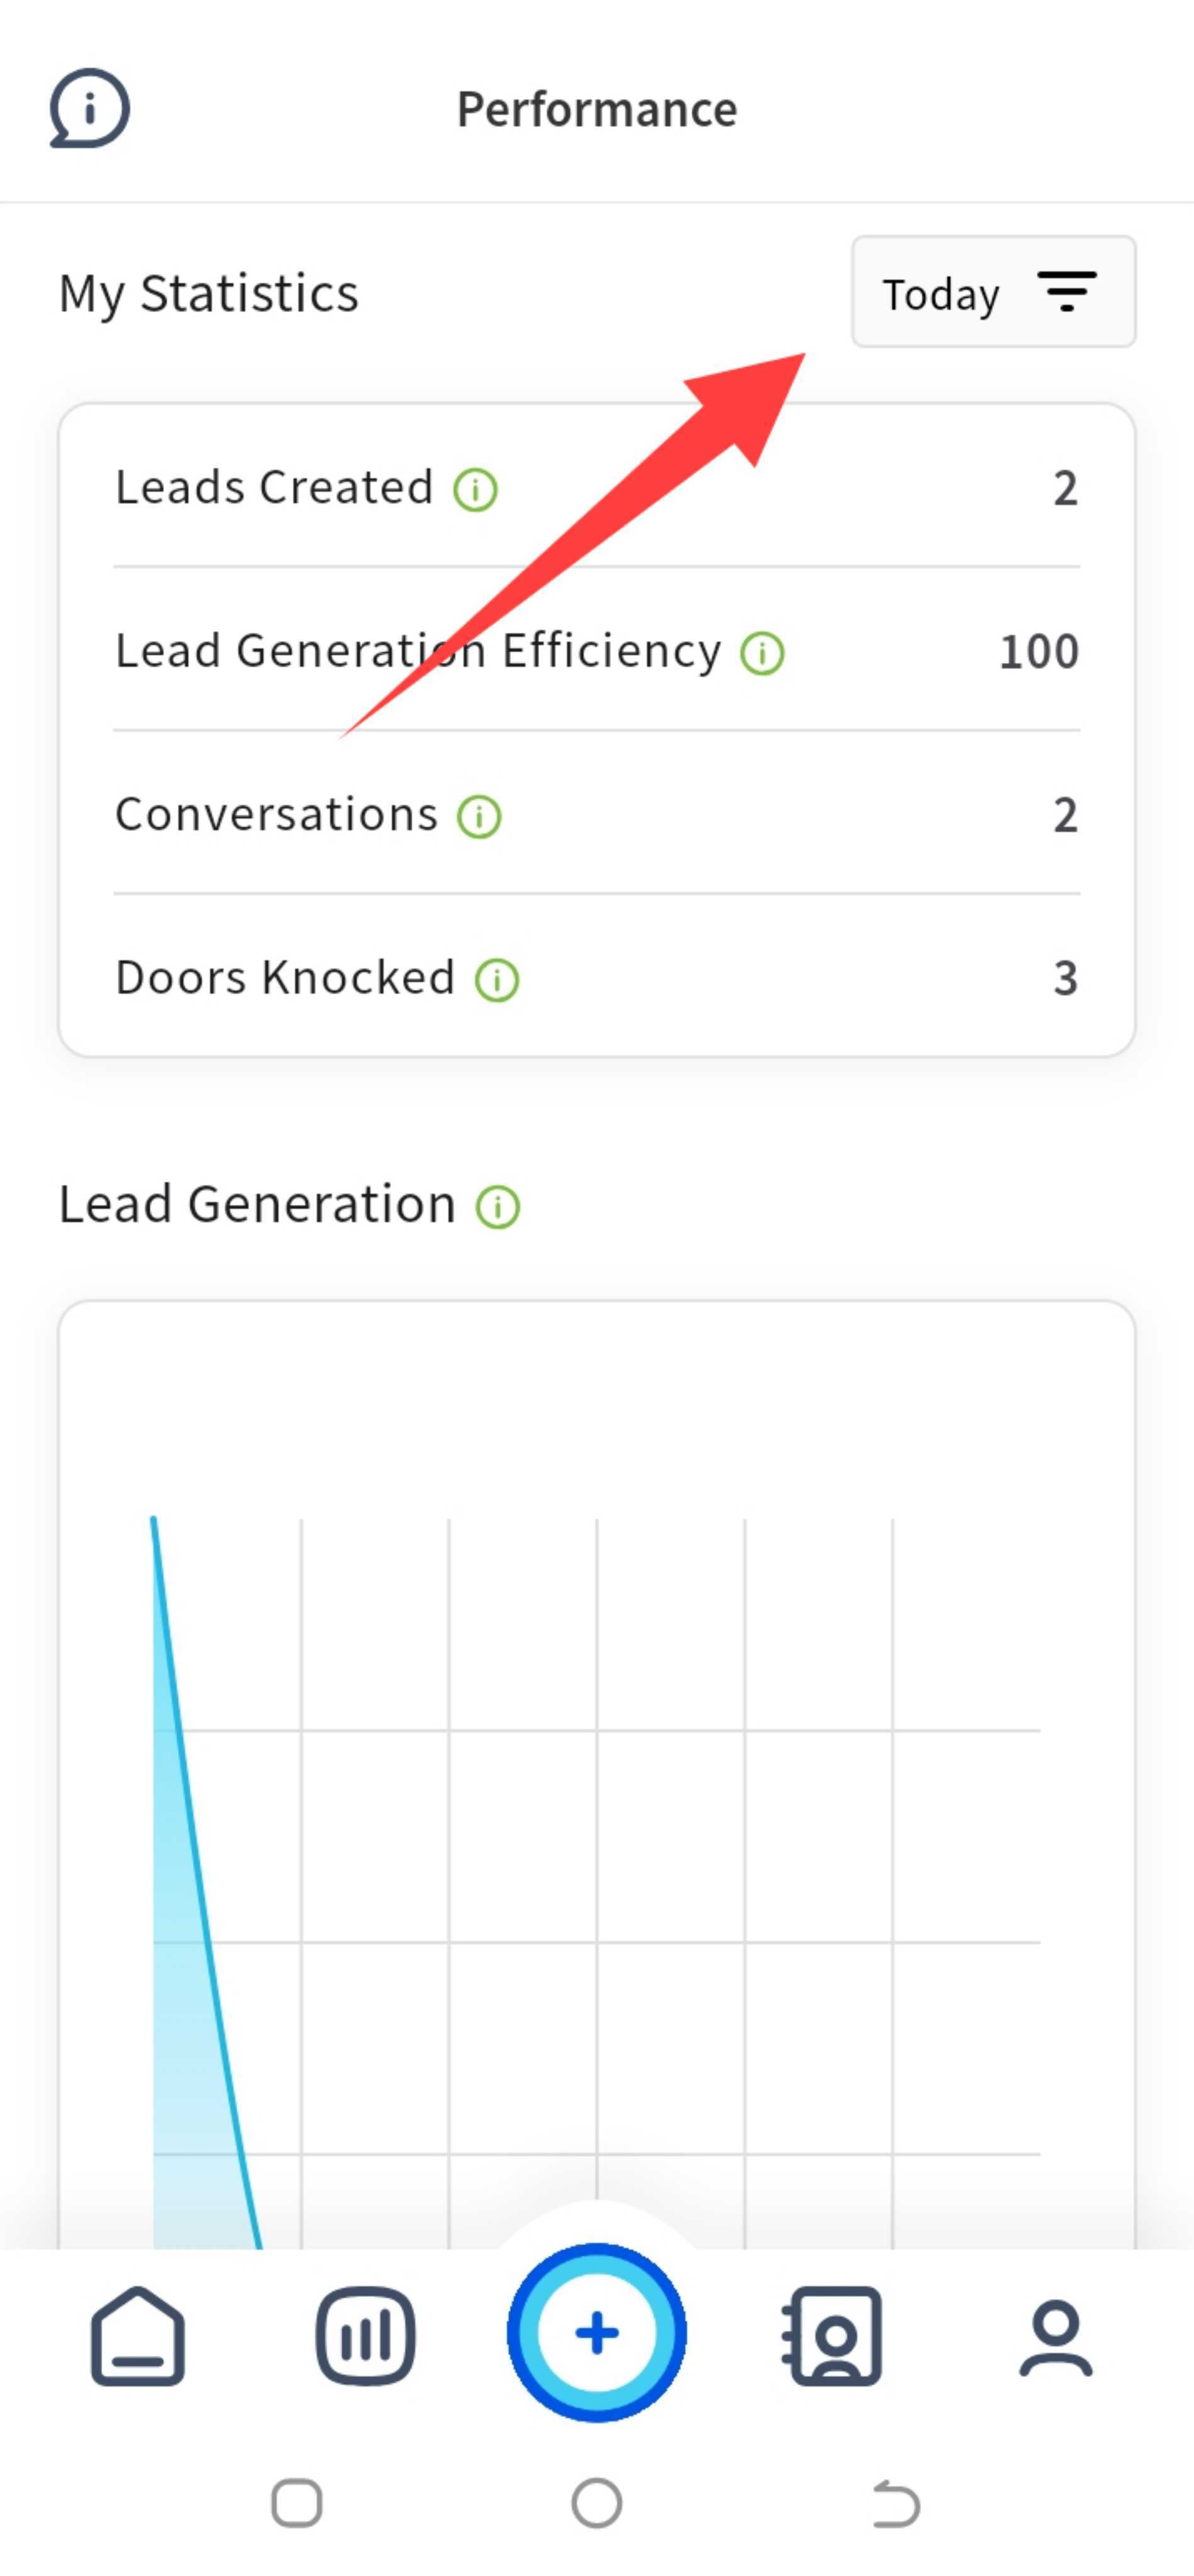
1. Leads Created: Here, you can monitor the total number of leads you've created within a specific period. These metrics helps you track your progress and productivity.
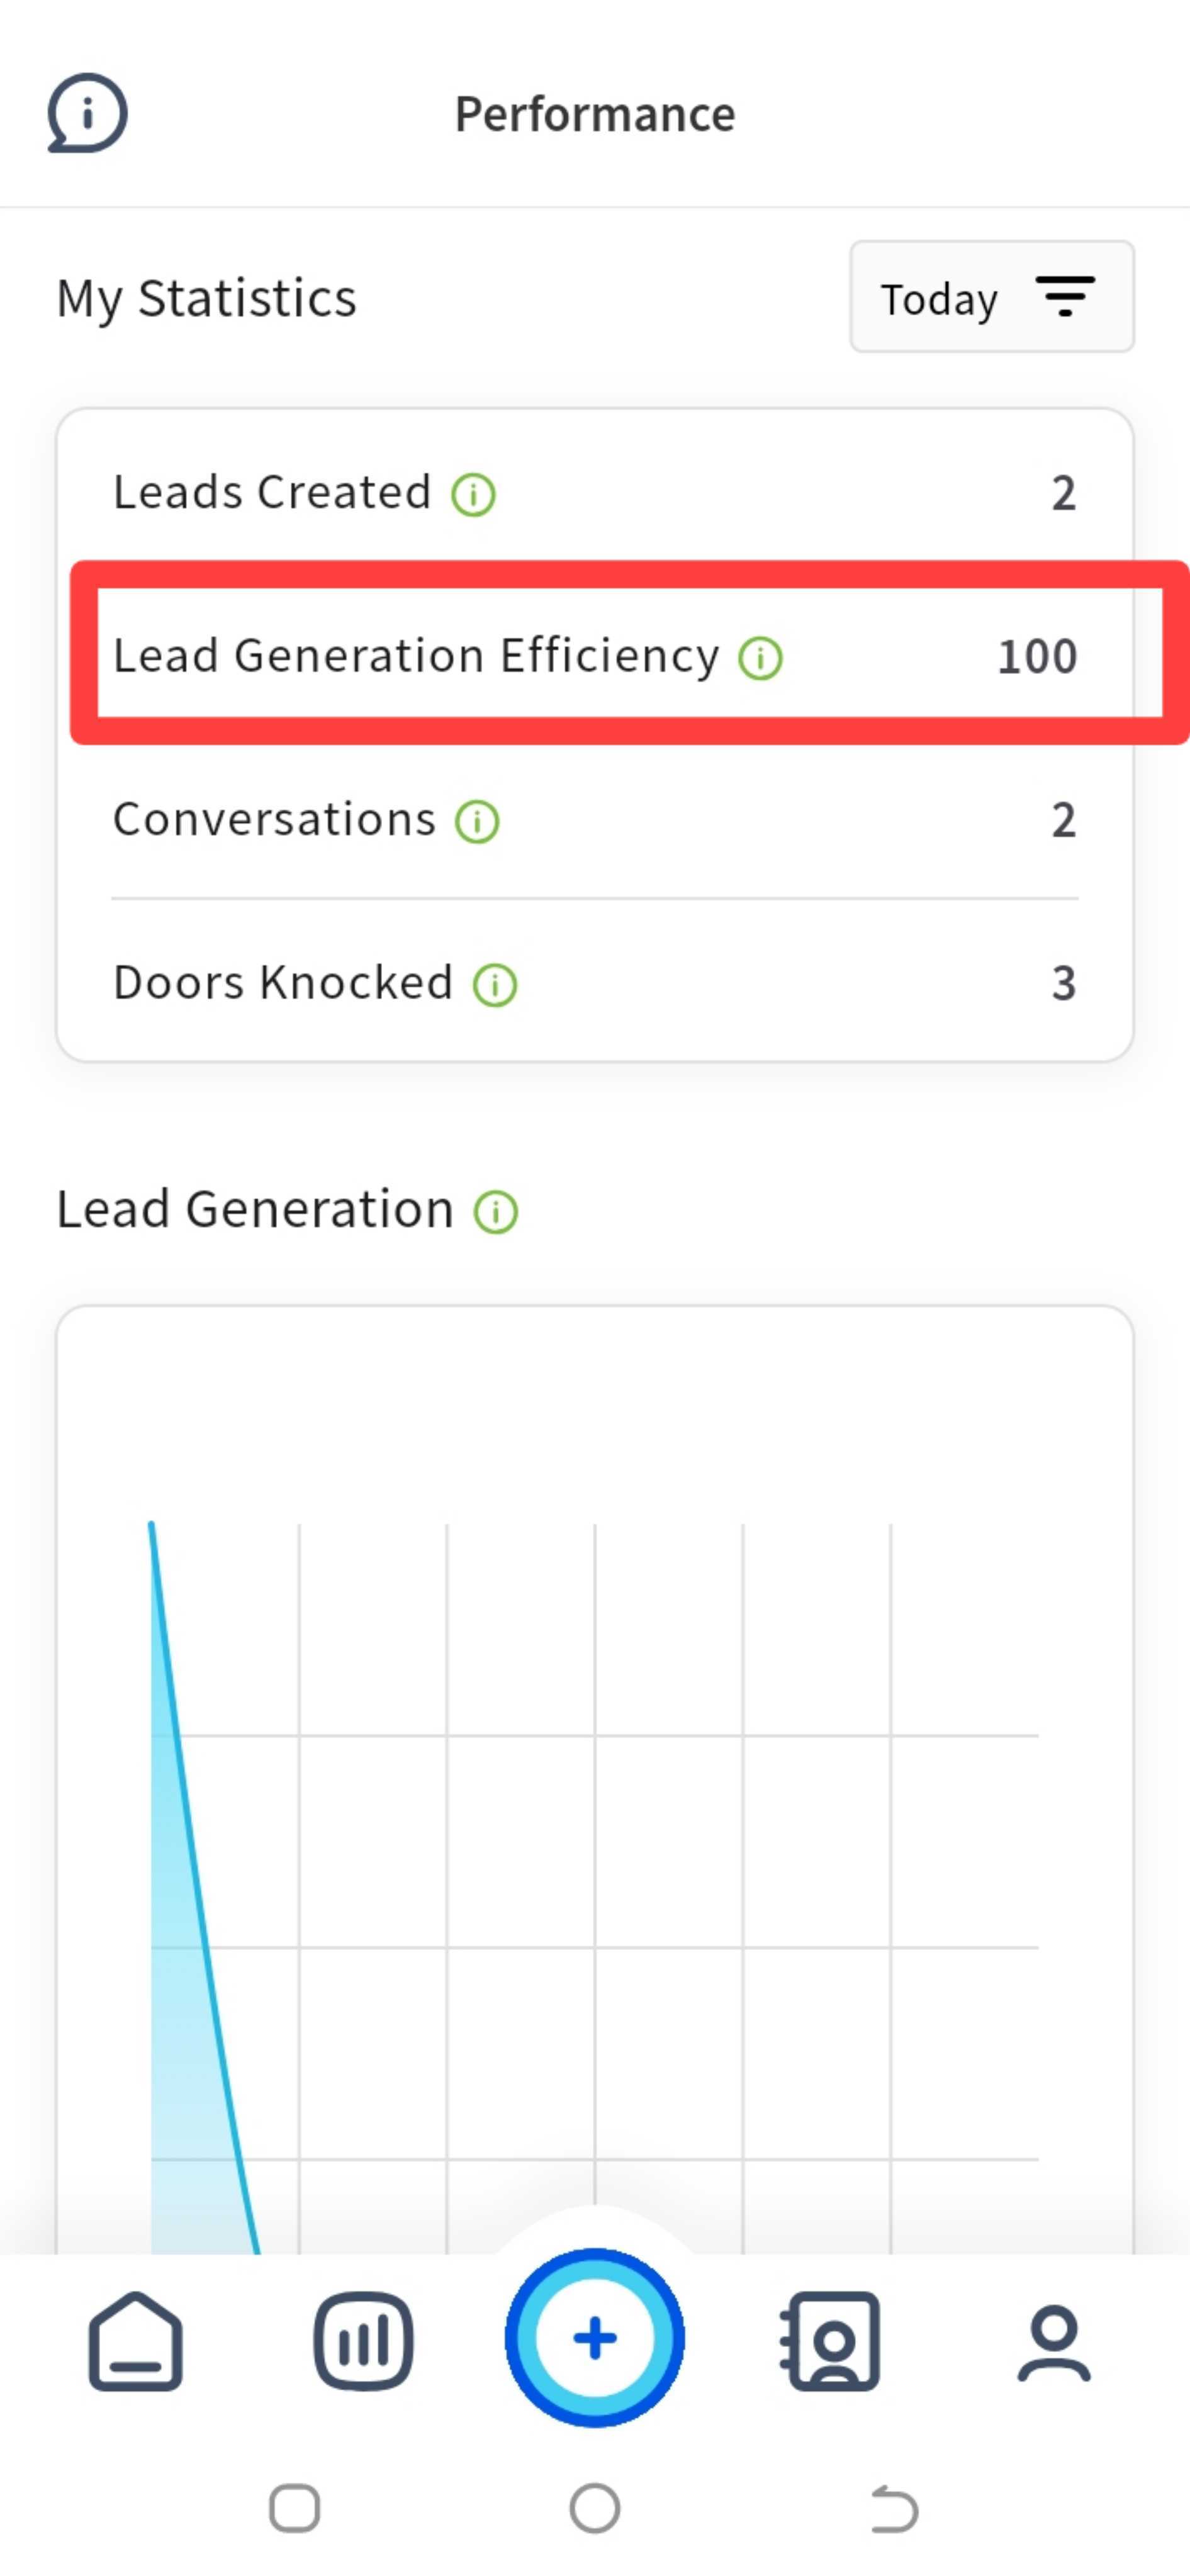
2. Leads Generation Efficiency: This metric reflects your efficiency in acquiring new leads. It serves as a scoreboard, letting you know how proficient you are at lead acquisition.
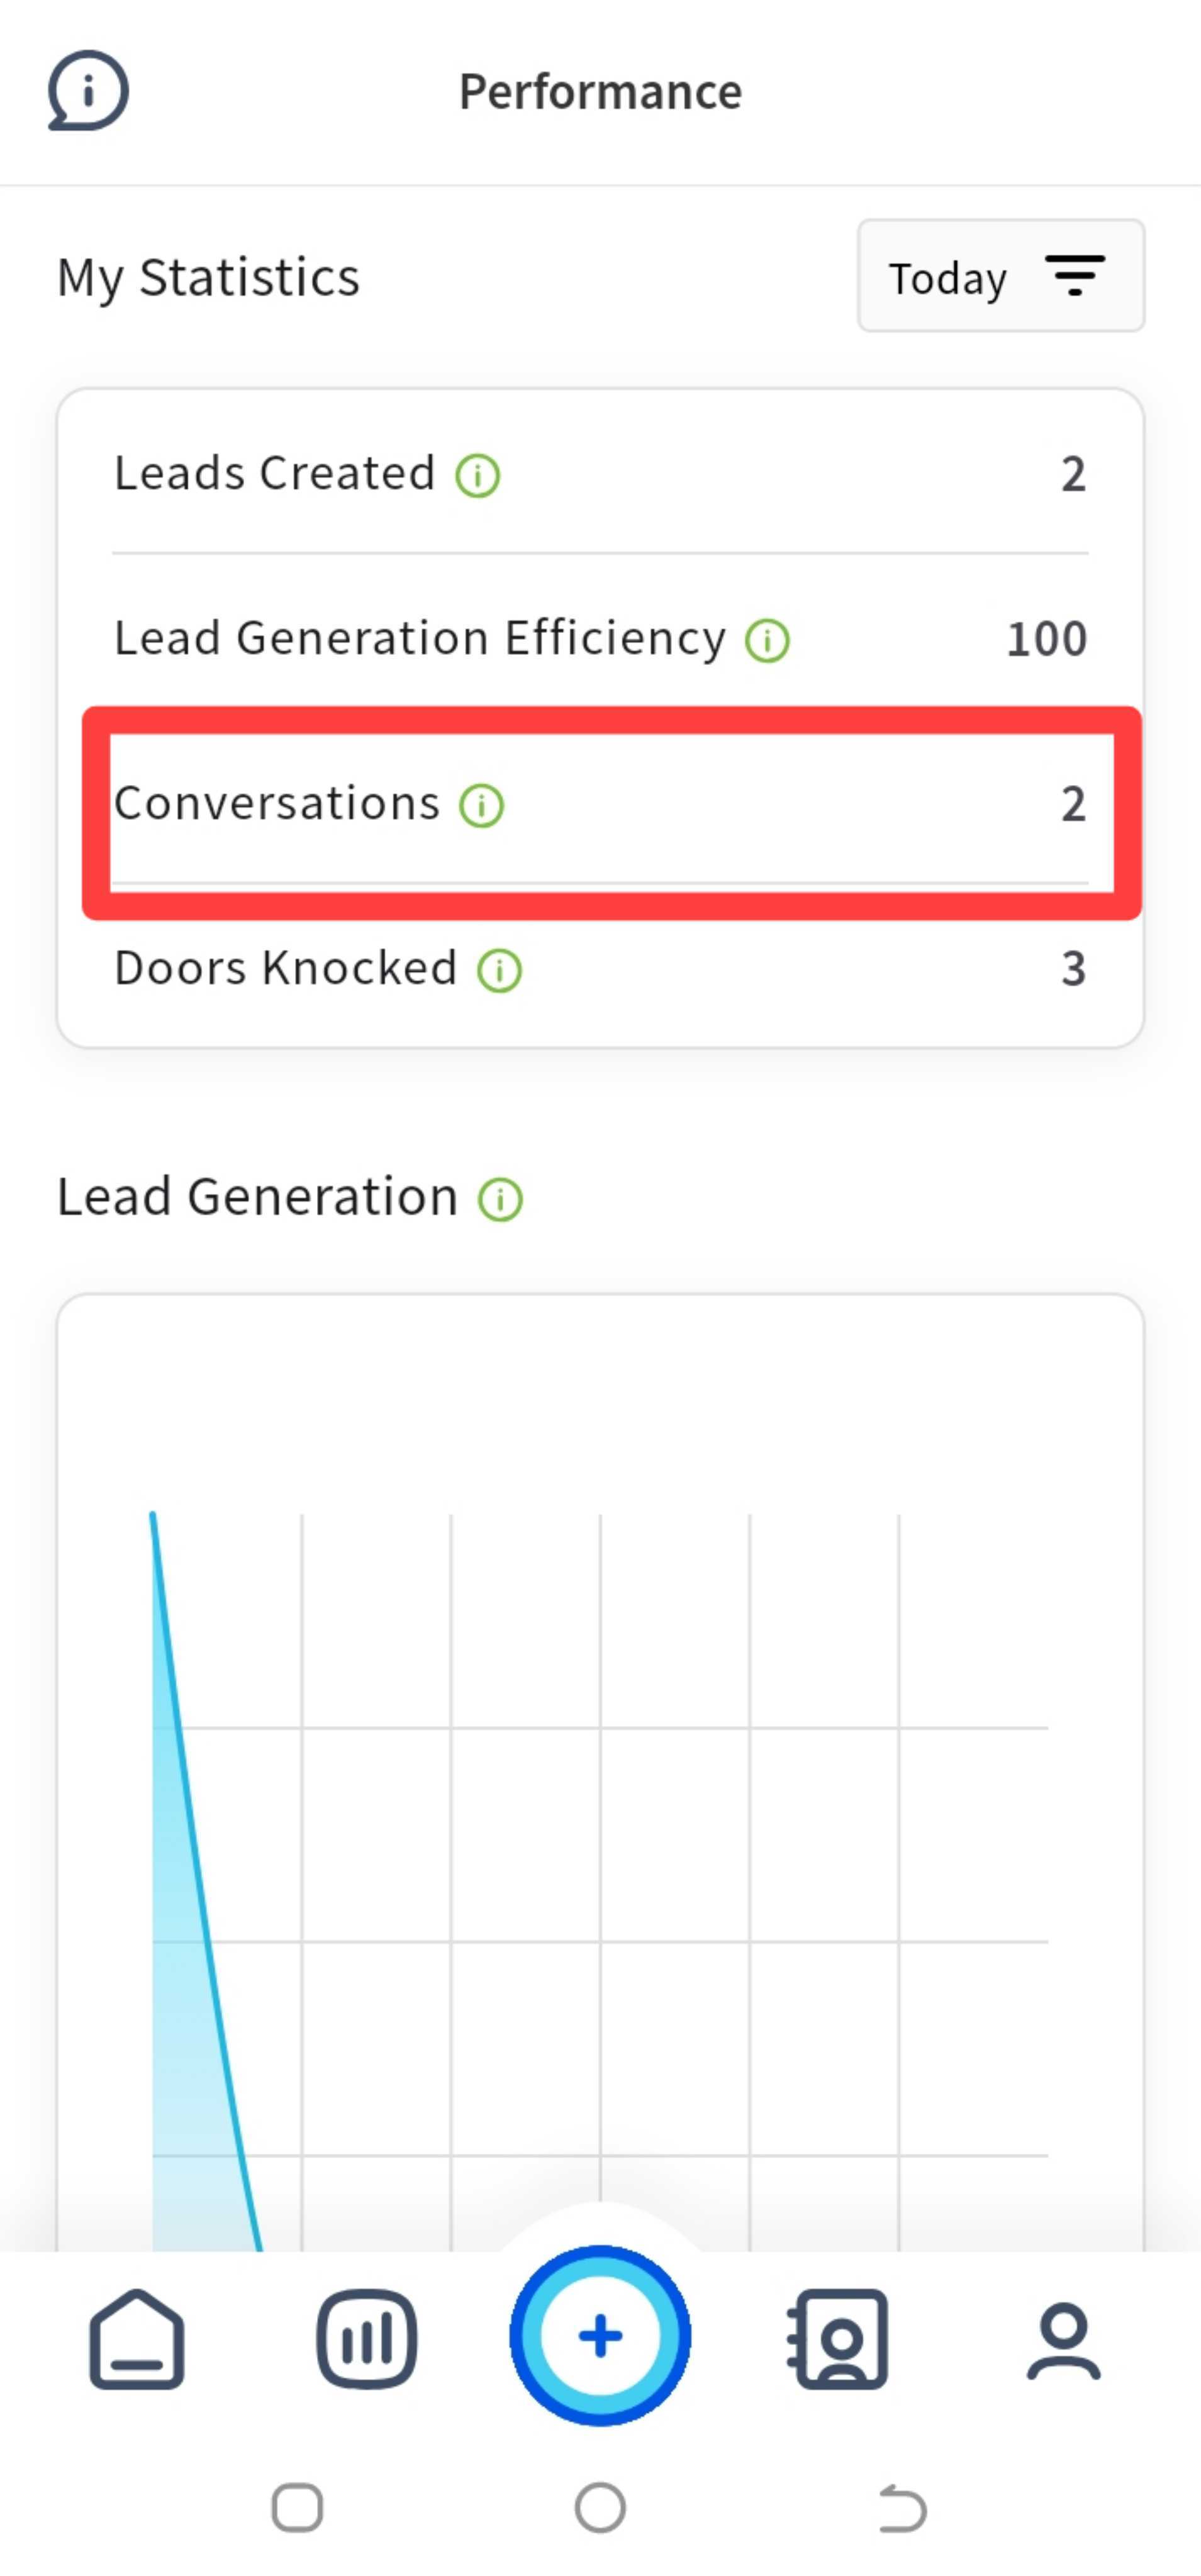
3. Conversations: You can also track the number of conversations you've had with leads or clients. This feature helps you gauge your communication and engagement levels.
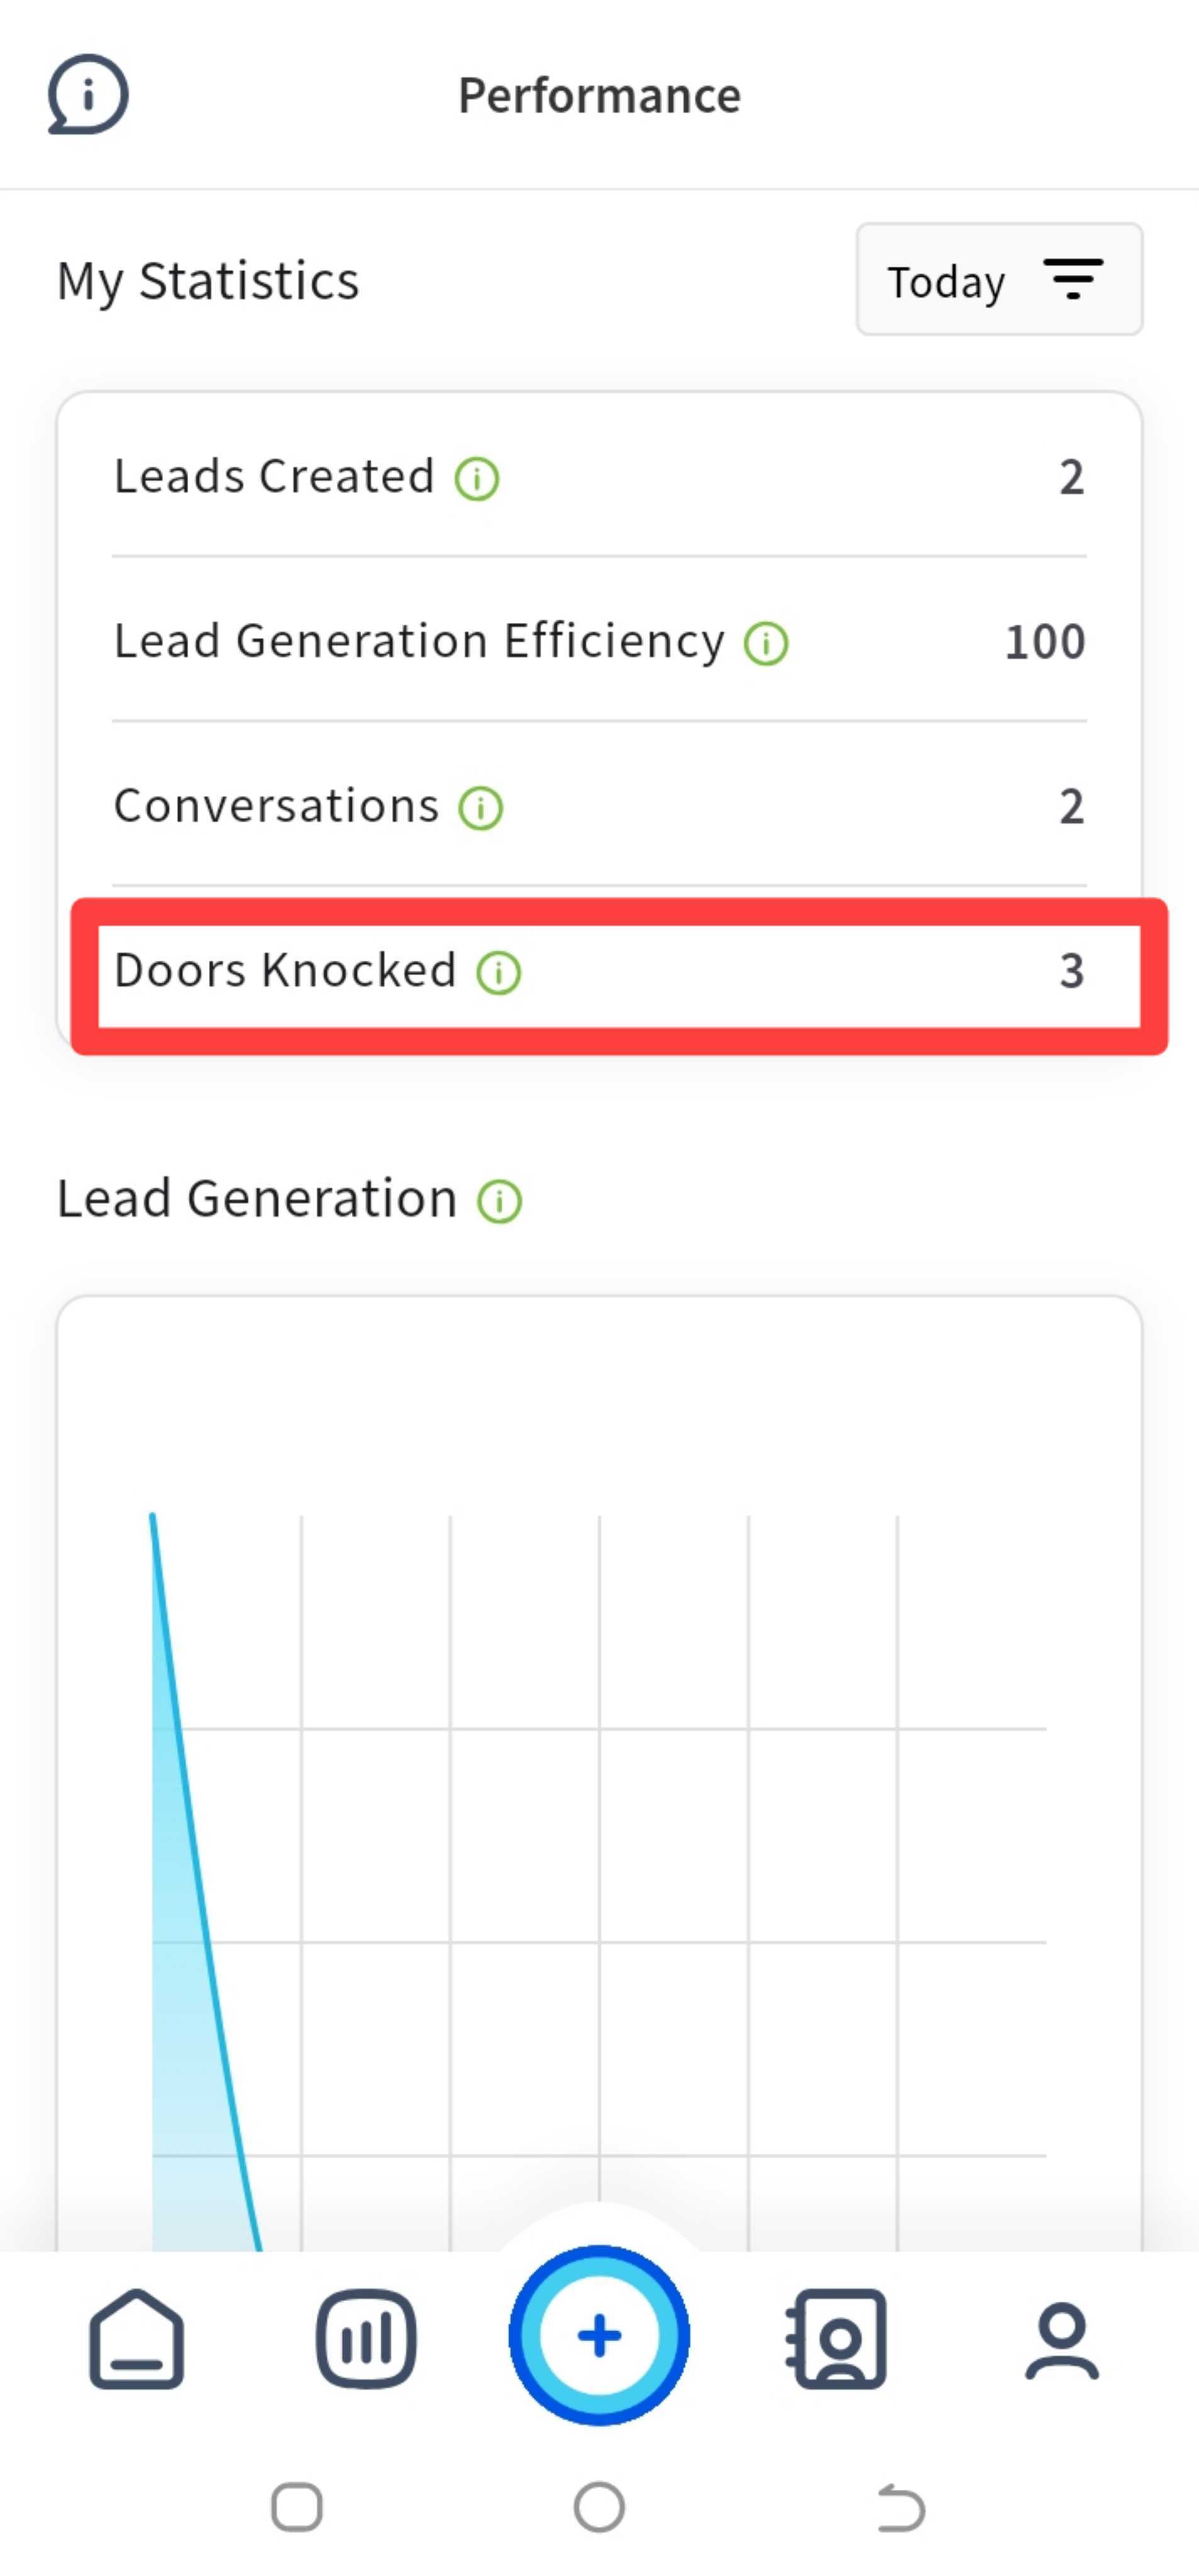
4. Doors Knocked: These metrics capture the number of doors you've knocked or properties you've visited within a period of time.
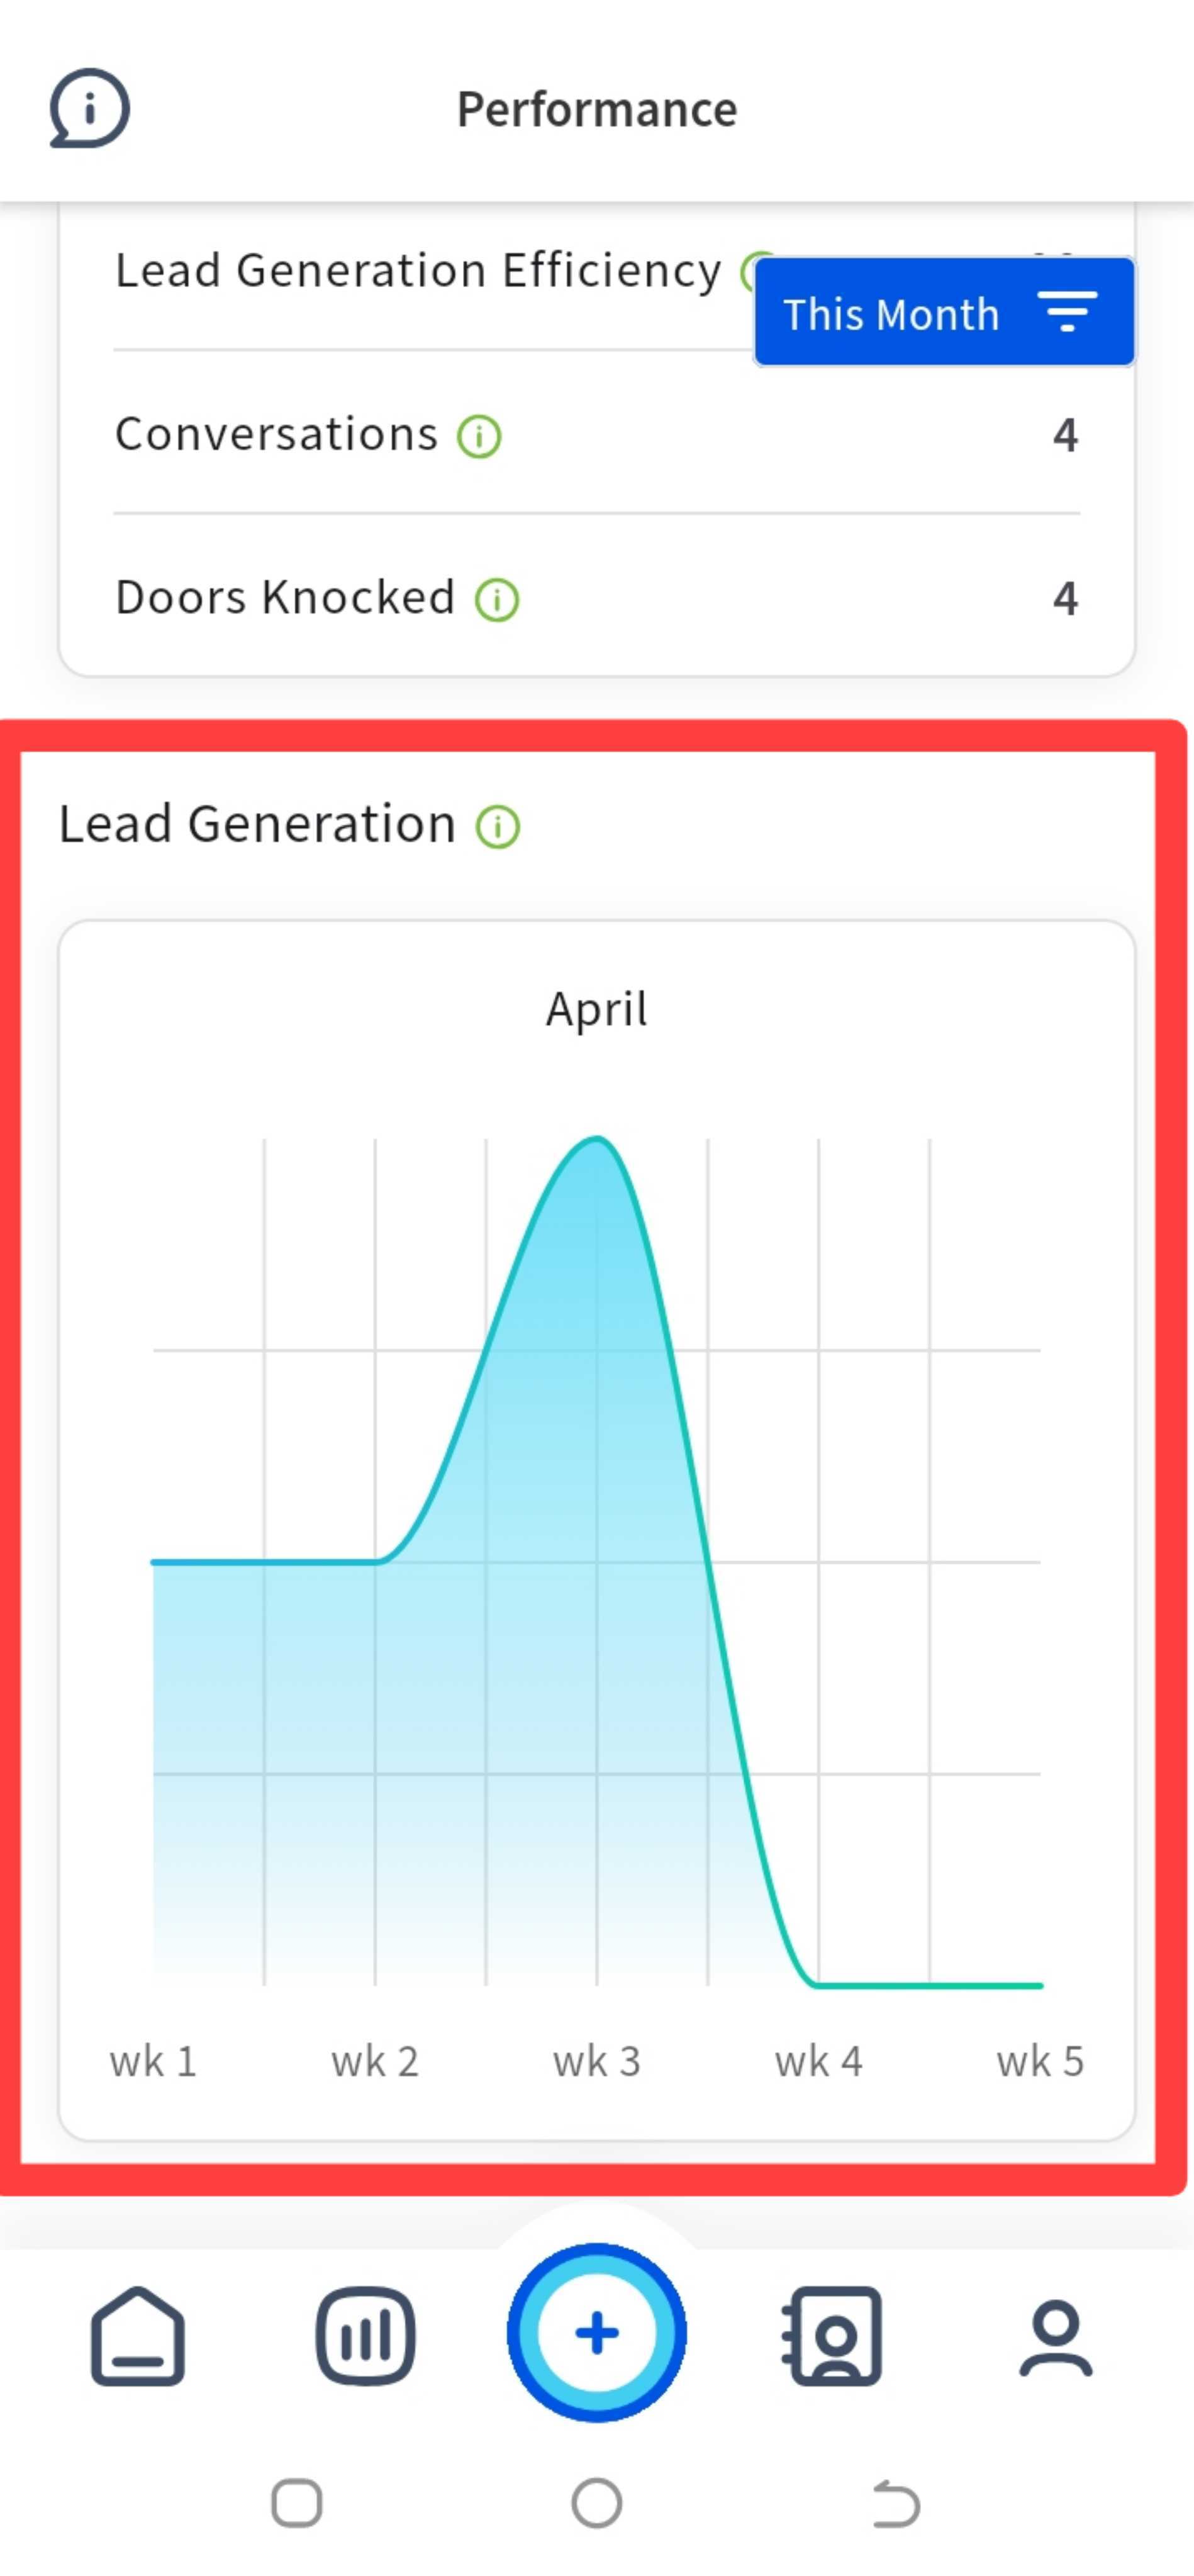
5. Lead Generation Graph: You can visualize your lead generation data using the graphs and charts provided within the app. This chart can help you identify trends and patterns over time.
Using the filter
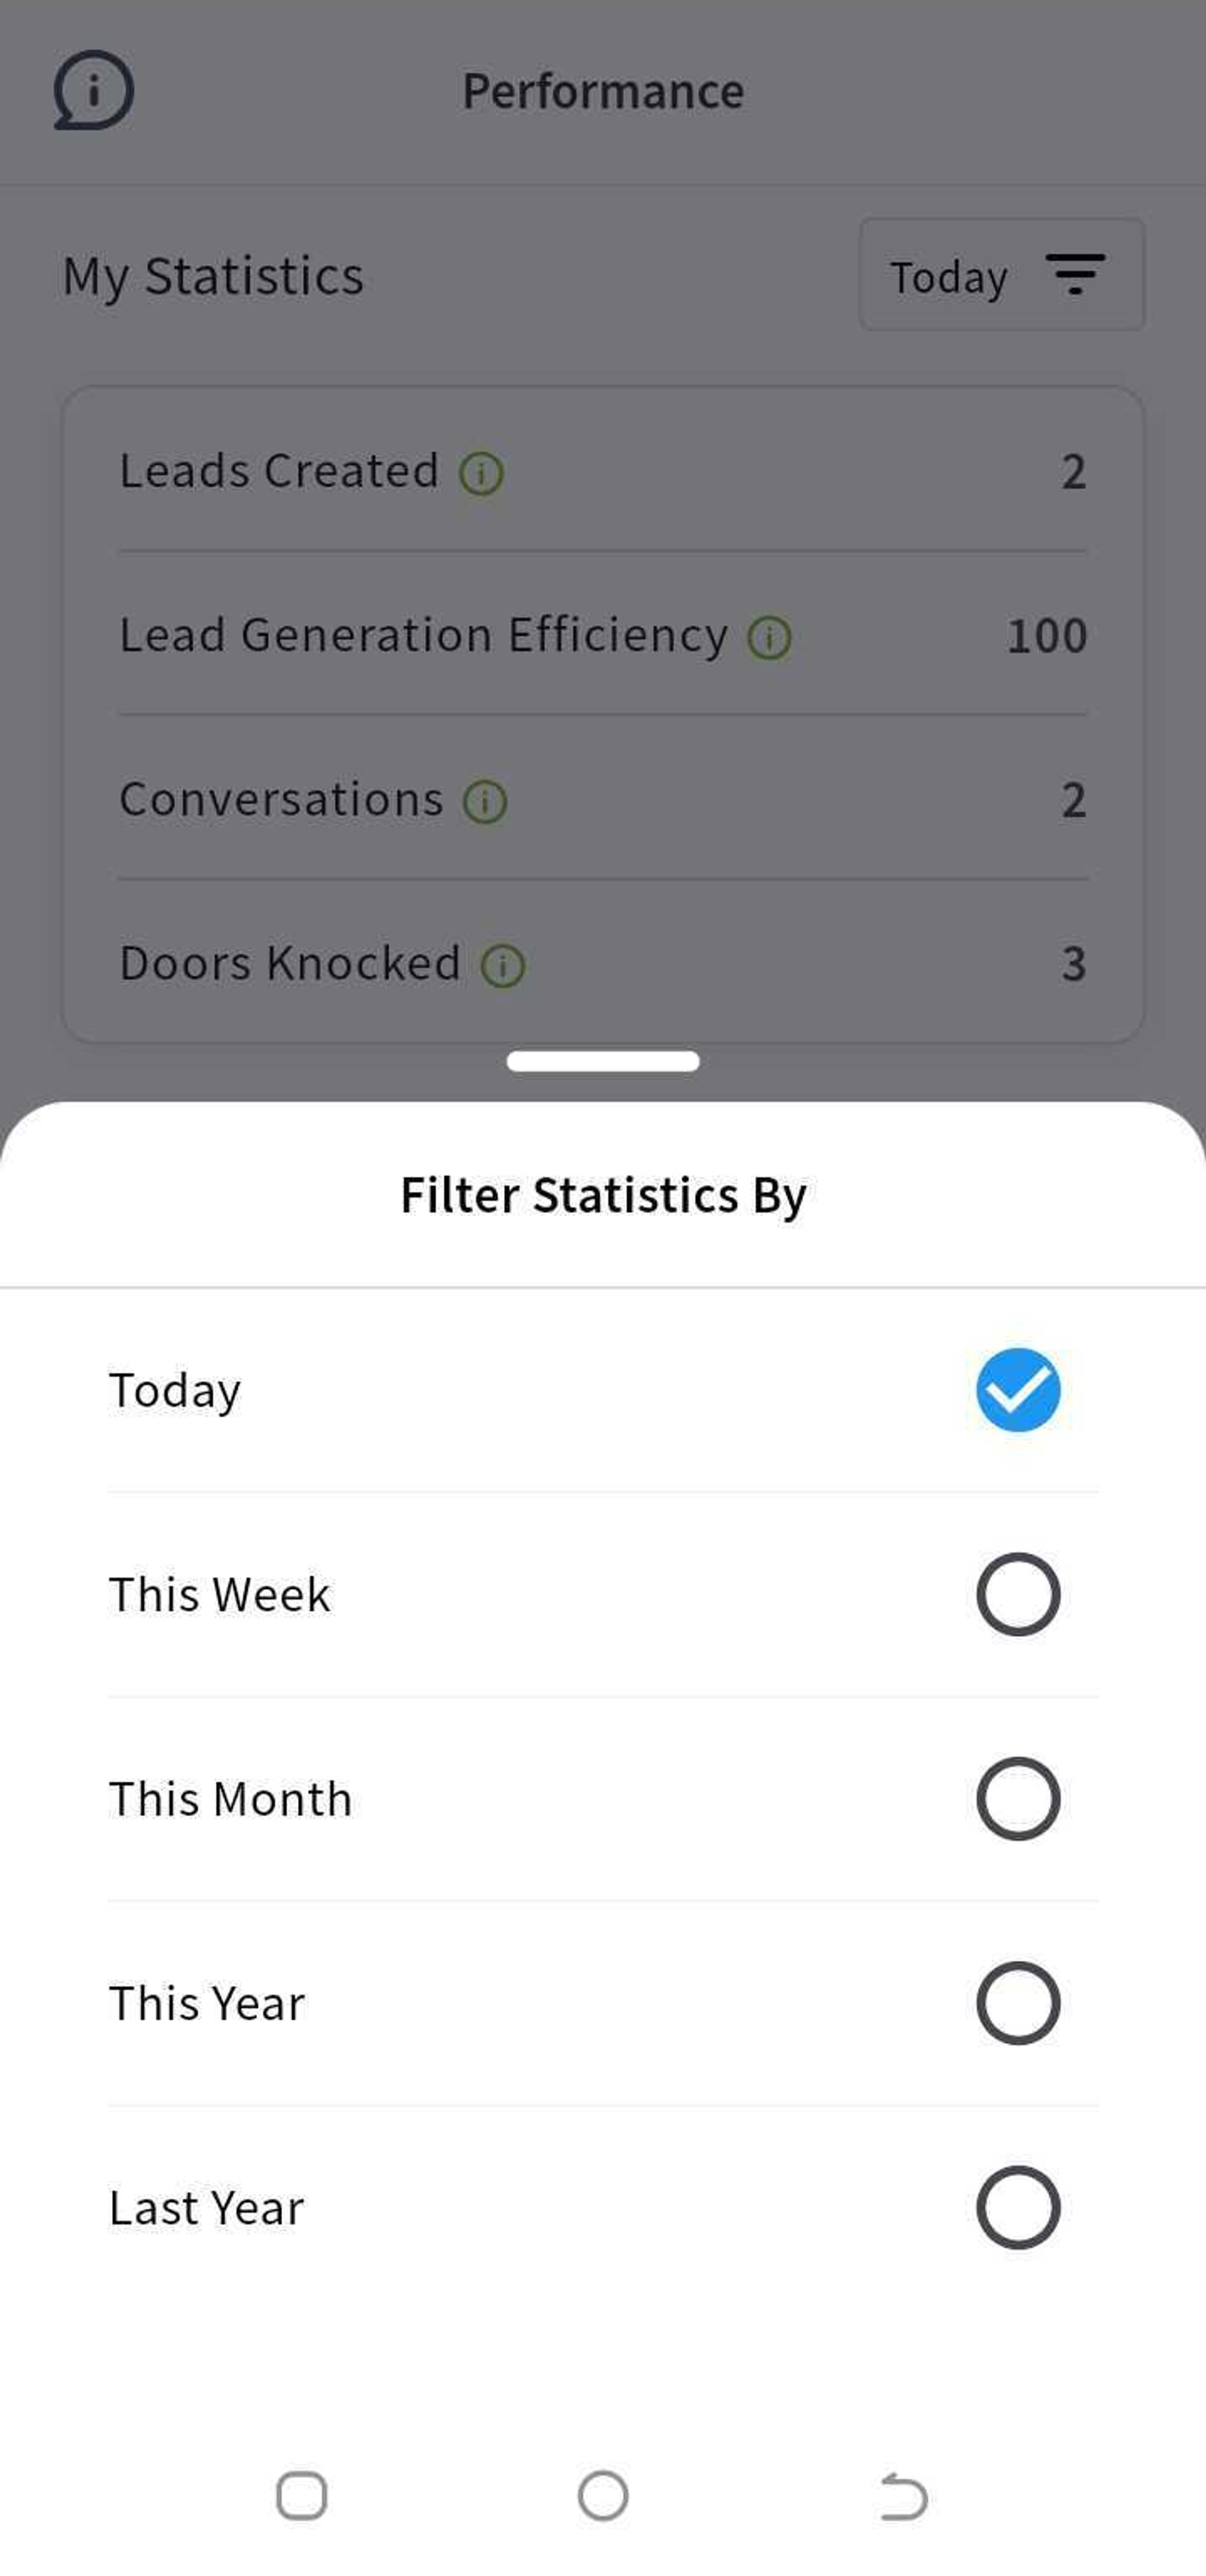
The Performance Statistics screen also provides filters that allow you to sort data by different time frames, such as 'Today', 'This Week', 'This Month', 'This Year', and 'Last Year'. To use this feature, simply select your desired time frame from the 'Filter' drop-down menu as shown below.
Remember, we're here to help. If you require further assistance or have any questions about the Performance Statistics screen, don't hesitate to contact our support team at support@harvast.com for further assistance.